Are you looking for a reliable way to detect residual dsRNA during mRNA in vitro transcription? Look no further than The Double-stranded RNA (dsRNA) ELISA Kit. However, with several commercial kits available, it's important to note that validation data may not always be publicly available, leading to inconsistency in dsRNA detection. That's why we're sharing our validation report of The Double-stranded RNA (dsRNA) ELISA Kit, covering specificity, precision, accuracy, sensitivity, and durability. This report serves as a reference guide to validate dsRNA residual detection methods tailored to specific experimental conditions and regulatory pharmacopoeial standards. Please learn more about our validation report to promote the standardization of dsRNA detection.
Double-stranded RNA (dsRNA) ELISA Kit
Product Validation Report
Ver.EN20231206
Background:
The Double-stranded RNA (dsRNA) ELISA Kit is a reagent kit designed to detect the residual dsRNA produced during the mRNA in vitro transcription process. Employing the experimental principle of double antibody sandwich enzyme-linked immunosorbent assay (ELISA) and the biotin-streptavidin amplification system, this kit offers sensitive detection of residual dsRNA in samples.
The summary data contains validation parameters covering specificity, precision, accuracy, sensitivity, and durability. The report acts as a reference guide, urging users to validate dsRNA residual detection methods tailored to their specific experimental conditions and adhering to regulatory pharmacopoeial standards.
Materials and Methods:
Kit: Double-stranded RNA (dsRNA) ELISA Kit: Cat#36717ES (YEASEN). The kit includes four distinct types of dsRNA standard samples. Users have the option to choose the standard sample type that aligns with their specific process for generating the standard curve, thereby avoiding the necessity of preparing and testing all samples.
Methods: The materials and procedural steps essential for the experiment are predominantly specified by Yeasen Biotechnology. The kit has undergone extensive testing and evaluation, ensuring its performance meets the stipulated requirements of ICH Q2(R1) and the 2020 edition of the Chinese Pharmacopoeia Part Four "9101 Analytical Method Validation Guidelines".
Results
- Linearity of dsRNA Standards
This report has developed standard curves for all four distinct types of dsRNA standards, each with a length of 300bp. These standards include STD1, unmodified dsRNA; STD2, Pseudo-UTP modified dsRNA; STD3, N1-Me-Pseudo-UTP modified dsRNA; and STD4, 5-OMe-UTP modified dsRNA. Each type of dsRNA standard exhibits excellent linearity of dilution with R2 > 0.99 and a coefficient of variation (CV) of measured concentration less than 10% shown in Table 1 to Table 5.
|
STD Name |
UTP Type |
Linearity of dilution (R2>0.99) |
CV |
|
STD1 |
UTP |
0.0156-1 pg/ μL |
<10% |
|
STD2 |
pUTP |
0.0156-1 pg/ μL |
<10% |
|
STD3 |
N1-Me-pUTP |
0.0312-1 pg/ μL |
<10% |
|
STD4 |
5-OMe-UTP |
0.0625-1 pg/ μL |
<10% |
Table 1. The linearity of different dsRNA standards.
|
STD1 concn.(pg/μL) |
Measured mean(pg/μL) |
Recovery |
CV |
|
1 |
1.0001 |
100.0% |
3.1% |
|
0.5 |
0.4994 |
99.9% |
2.4% |
|
0.25 |
0.2516 |
100.7% |
3.3% |
|
0.125 |
0.1227 |
98.1% |
0.5% |
|
0.0625 |
0.0640 |
102.5% |
3.2% |
|
0.0312 |
0.0309 |
99.2% |
1.3% |
|
0.0156 |
0.0157 |
100.4% |
3.2% |
|
0 |
/ |
/ |
/ |
Table 2. The recovery and CV of diluted STD1
|
STD2 concn.(pg/μL) |
Measured mean(pg/μL) |
Recovery |
CV |
|
1 |
1.0001 |
100.0% |
0.7% |
|
0.5 |
0.4994 |
99.9% |
0.1% |
|
0.25 |
0.2514 |
100.6% |
0.9% |
|
0.125 |
0.1232 |
98.6% |
2.5% |
|
0.0625 |
0.0635 |
101.6% |
1.1% |
|
0.0312 |
0.0312 |
99.9% |
0.5% |
|
0.0156 |
0.0155 |
99.6% |
0.0% |
|
0 |
/ |
/ |
/ |
Table 3. The recovery and CV of diluted STD2
|
STD3 concn.(pg/μL) |
Measured mean(pg/μL) |
Recovery |
CV |
|
2 |
2.0031 |
100.2% |
1.6% |
|
1 |
0.9880 |
98.8% |
2.4% |
|
0.5 |
0.5188 |
103.8% |
1.2% |
|
0.25 |
0.2383 |
95.3% |
2.2% |
|
0.125 |
0.1242 |
99.4% |
0.1% |
|
0.0625 |
0.0629 |
100.7% |
1.8% |
|
0.0312 |
0.0361 |
115.7% |
1.6% |
|
0 |
/ |
/ |
/ |
Table 4. The recovery and CV of diluted STD3
|
STD4 concn.(pg/μL) |
Measured mean(pg/μL) |
Recovery |
CV |
|
4 |
4.0096 |
100.2% |
1.9% |
|
2 |
1.9940 |
99.7% |
0.7% |
|
1 |
0.9977 |
99.8% |
0.1% |
|
0.5 |
0.5108 |
102.2% |
0.1% |
|
0.25 |
0.2454 |
98.2% |
5.6% |
|
0.125 |
0.1207 |
96.5% |
2.8% |
|
0.0625 |
0.0624 |
99.9% |
0.3% |
|
0 |
/ |
/ |
/ |
Table 5. The recovery and CV of diluted STD4
-
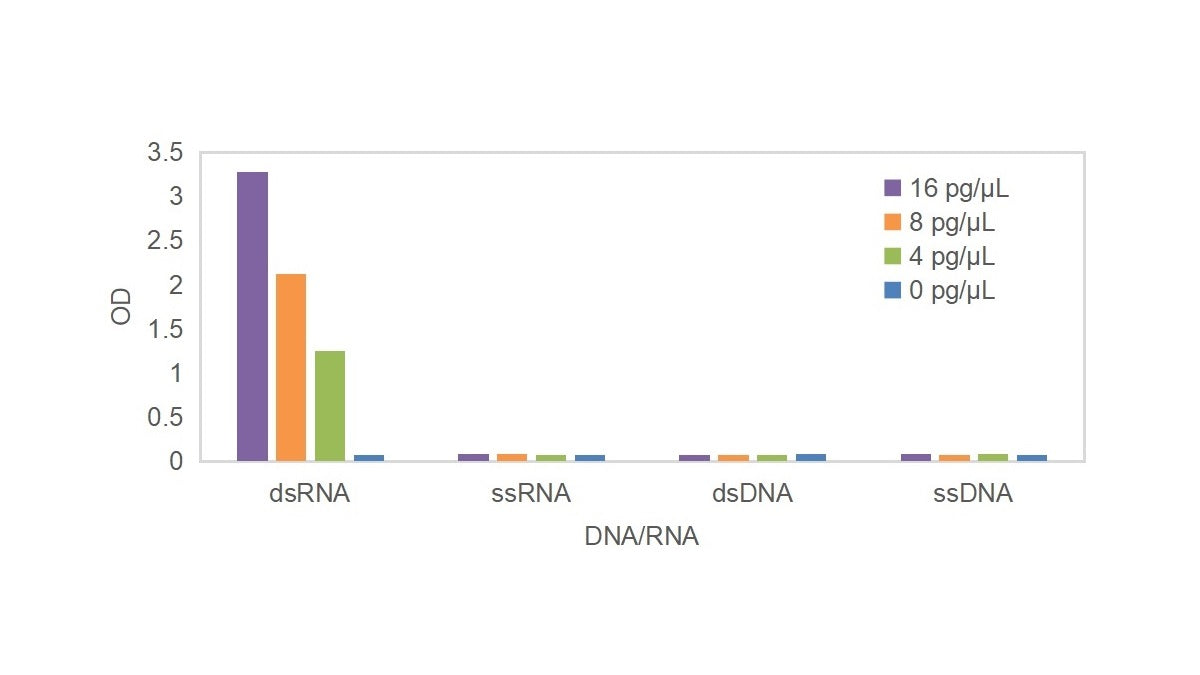
Specificity
- Specificity analysis with dsRNA, ssRNA, dsDNA, and ssDNA.

- Specificity was not affected by length of dsRNAs.

-
Accuracy
Adding 0.5 pg/μL of STD1 to a known mRNA sample with a dsRNA content of 0.36 pg/μL was conducted in three different volume ratios (1:1, 1:20, 1:250). In all cases, the spike recovery rates fell within the 80-120% range.
The spike recovery rate is calculated as follows: Spike Recovery Rate=(Measured concentration after spiking×Total volume of spiked sample−Measured concentration of the sample×Total volume of the sample)/(Theoretical concentration of the spike×Volume of the spike)×100%
|
Samples |
Volume Ratio of STD1/Sample |
Measured dsRNA (pg/μL) |
Spike Recovery Rate |
|
Sample (TS) |
/ |
0.36 |
/ |
|
TS+0.5pg/μL STD1 |
1:1 |
0.769 |
81% |
|
TS+0.5pg/μL STD1 |
1:20 |
0.777 |
82% |
|
TS+0.5pg/μL STD1 |
1:250 |
0.803 |
82% |
Table 6. The spike recovery rate analysis
-
Precision
- Intra-assay precision
Experiments were conducted on three concentration levels (high, medium, and low) for each of the four dsRNA standard samples. Within a single experiment, each concentration sample underwent eight repeated tests. The results shows the coefficient of variation (CV) is below 15% indicating a good intra-assay precision.
|
STD1 |
|||
|
Theoretical concn. (pg/μL) |
Replicates |
Measured mean (pg/μL) |
CV |
|
1 |
8 |
1.0002 |
3.11% |
|
0.125 |
8 |
0.1230 |
0.46% |
|
0.0156 |
8 |
0.0164 |
3.18% |
|
STD2 |
|||
|
Theoretical concn. (pg/μL) |
Replicates |
Measured mean (pg/μL) |
CV |
|
1 |
8 |
1.0001 |
0.65% |
|
0.125 |
8 |
0.1231 |
2.46% |
|
0.0156 |
8 |
0.0162 |
0.02% |
|
STD3 |
|||
|
Theoretical concn. (pg/μL) |
Replicates |
Measured mean (pg/μL) |
CV |
|
2 |
8 |
2.0022 |
1.58% |
|
0.25 |
8 |
0.2444 |
2.17% |
|
0.0312 |
8 |
0.0328 |
1.64% |
|
STD4 |
|||
|
Theoretical concn. (pg/μL) |
Replicates |
Measured mean (pg/μL) |
CV |
|
8 |
8 |
8.0803 |
0.27% |
|
1 |
8 |
0.9650 |
0.12% |
|
0.125 |
8 |
0.1322 |
2.76% |
Table 7. Intra-assay precision analysis
- Inter-assay precision
Three experiments were carried out using kits from 3 batches. In each experiment, high, medium, and low concentrations were chosen and tested three times for each of the four dsRNA standard samples, with eight replicates. Consequently, 24 data points were acquired at each concentration level, which were then utilized for coefficient of variation (CV) analysis.The results show that the CV for each concentration of the standards was below 15%.
|
STD1 |
|||
|
Theoretical concn. (pg/μL) |
Independent Tests/Replicates |
Measured mean (pg/μL) |
CV |
|
1 |
3/8 |
1.0007 |
2.38% |
|
0.125 |
3/8 |
0.1186 |
3.20% |
|
0.0156 |
3/8 |
0.0173 |
1.27% |
|
STD2 |
|||
|
Theoretical concn. (pg/μL) |
Independent Tests/Replicates |
Measured mean (pg/μL) |
CV |
|
1 |
3/8 |
0.9987 |
0.09% |
|
0.125 |
3/8 |
0.1269 |
1.06% |
|
0.0156 |
3/8 |
0.0151 |
0.52% |
|
STD3 |
|||
|
Theoretical concn. (pg/μL) |
Independent Tests/Replicates |
Measured mean (pg/μL) |
CV |
|
2 |
3/8 |
2.0012 |
2.37% |
|
0.25 |
3/8 |
0.2415 |
0.14% |
|
0.0312 |
3/8 |
0.0330 |
1.81% |
|
STD4 |
|||
|
Theoretical concn. (pg/μL) |
Independent Tests/Replicates |
Measured mean (pg/μL) |
CV |
|
8 |
3/8 |
7.9735 |
1.89% |
|
1 |
3/8 |
1.0225 |
0.13% |
|
0.125 |
3/8 |
0.1227 |
5.63% |
Table 8. Inter-assay precision analysis
-
Sensitivity
- LOD
The detection limit of the kit is determined by adding twice the standard deviation to the mean of the blank values. By measuring the OD of 24 blanks, calculating their mean and standard deviation, and then applying these values to the fitted curve, the corresponding limit of detection is obtained.
|
|
OD |
|
||
|
dsRNA Standard |
Mean of Blank |
SD of Blank |
Mean of Blank+2SD |
LOD |
|
STD1 |
0.016 |
0.00048 |
0.01696 |
≤0.001pg/μL |
|
STD2 |
0.016 |
0.00072 |
0.01744 |
≤0.001pg/μL |
|
STD3 |
0.034 |
0.00119 |
0.03638 |
≤0.001pg/μL |
|
STD4 |
0.115 |
0.00290 |
0.1208 |
≤0.01pg/μL |
Table 9. LOD analysis
- LOQ
The quantitative limit of the kit is established by diluting the lowest concentration point of the standard curve to even lower levels, ensuring a CV < 20% at the lowest concentration, thereby defining the quantitative threshold. The LOQ is as the following.
|
dsRNA Standard |
LOQ |
Replicates |
CV(%) |
Recovery (%) |
|
STD1 |
0.0156 pg/μL |
24 |
<10% |
80~120% |
|
STD2 |
0.0312 pg/μL |
24 |
<10% |
80~120% |
|
STD3 |
0.0156 pg/μL |
24 |
<10% |
80~120% |
|
STD4 |
0.125 pg/μL |
24 |
<10% |
80~120% |
Table 10. LOQ analysis
-
Durability
- Anti-interference on IVT materials
This test aimed to assess the impact of various enzymes, buffers, etc., added to the mRNA sample on the dsRNA detection by the kit.
Adding specific concentrations of T7 RNA polymerase, RNAse Inhibitor, IPPA (inorganic pyrophosphatase), DNase I, VCE (vaccinia capping enzyme), 2'-O-Methyltransferase (MT), 1×IVT buffer, and 1mM sodium citrate to a provided mRNA sample, and subsequently utilizing STD3 for both standard curve preparation and sample testing, enabled the evaluation of the kit's ability to detect dsRNA content in these samples. The results demonstrate that the presence of eight different enzymes and buffers did not affect the accurate detection of dsRNA. Additionally, the observed recovery rates fell within the range of 80% to 120%.
|
IVT Materials |
dsRNA Measured (pg/μL) |
Recovery |
|
None |
0.6057 |
100% |
|
T7 RNA Polymerase (15μg/mL) |
0.5411 |
89.32% |
|
Murine RNase Inhibitor (27.5μg/mL) |
0.5142 |
84.88% |
|
Inorganic Pyrophosphatase (IPPA 10μg/mL) |
0.7132 |
117.7% |
|
DNase I (13.75μg/mL) |
0.6077 |
100.32% |
|
Vaccinia Capping Enzyme (10μg/mL) |
0.6563 |
108.3% |
|
2´-O-Methyltransferase (10μg/mL) |
0.5776 |
95.4% |
|
1×IVT buffer |
0.5003 |
82.6% |
|
1mM Sodium citrate |
0.6251 |
103.2% |
Table 11. The recovery of diluted STD3 added with IVT materials
- Temperature durability
The kits were stored at both 4°C and 37°C to detect the concentration variances of dsRNA standard after 7 days. The results show that the variances are all within 20%.
|
dsRNA Standard |
dsRNA Measured (pg/μL) Day 0 |
The variances after 7 days at 4°C |
|
STD1 |
1 |
10% |
|
STD2 |
1 |
5% |
|
STD3 |
2 |
7% |
|
STD4 |
4 |
11% |
|
dsRNA Standard |
dsRNA Measured (pg/μL) |
The variances after 7 days at 37°C |
|
STD1 |
1 |
18% |
|
STD2 |
1 |
4% |
|
STD3 |
2 |
5% |
|
STD4 |
4 |
8% |
Table 12. Temperature durability analysis
Related Product:
| Product name | SKU | Specifications |
| Double-stranded RNA (dsRNA) ELISA kit | 36717ES | 48T/96T |
| T7 RNA Polymerase (low ds RNA, 250 U/μL) | 10628ES | 10/100 KU |
| T7 RNA Polymerase GMP-grade(250 U/μL) | 10625ES | 10/100 KU |
Related Reading:
The Double-stranded RNA (dsRNA) ELISA Kit was employed to validate low dsRNA T7 RNA polymerase mutants, in conjunction with the J2 antibody dot blotting method.
Low dsRNA T7 RNA Polymerase Mutants, Empowering mRNA Vaccine and Therapy DevelopmentReferences:
- ICH, 2022: Analytical Method Validation Q2, draft version.
- NMPA, 2007: General Principles for the Evaluation of Analytical Method Validation for Biological Product Quality Control Analysis
- Chinese Pharmacopoeia Commission (ChPC), 2020: Chinese Pharmacopoeia, Part Four: Guidelines for the Validation of Quantitative Analysis Methods for Biological Samples